
Accessibility Best Practices and Insights from the 2026 Digital Trust Index
In the digital world, your website is more than just a marketing tool—it is the primary way your customers find information, shop, and engage with your brand. However, if your "front door" isn't accessible to everyone, you are effectively turning away a significant portion of your audience. As we continue to track the foundations of digital reliability, accessibility remains a non-negotiable component of building and maintaining consumer trust.
The Oshyn Digital Trust Index measures this through the Accessibility pillar, which evaluates the protocols in place to enhance interactivity for people who require accessibility accommodations.
What is the Accessibility Pillar?
The Accessibility pillar focuses on how usable your website is for all users, regardless of their physical or cognitive abilities. Improving accessibility isn't just a requirement for people with disabilities; it creates a more frictionless and connected experience for everyone. For instance, as users age, they often require larger text and clearer color contrast—features that benefit all visitors by making navigation more intuitive.
Beyond the moral and user-experience imperatives, accessibility has a clear bottom-line advantage. Research shows that 27% of people with disabilities give up on online purchases at least monthly due to accessibility barriers. Furthermore, while not a direct ranking factor, accessible websites naturally align with SEO best practices, helping your brand stand out in search results.
What We Measure
The Accessibility pillar evaluates how usable your site is regardless of a person's physical or cognitive abilities. Improving accessibility not only helps people with disabilities but also creates a more frictionless, connected experience for everyone. To determine the scores in this pillar, we assess three specific areas:
- Accessibility Errors: Critical issues like missing image alt text, missing form input labels, empty links, or empty buttons.
- Contrast Errors: Instances where text and background colors are too similar, making content difficult to read for many users.
- Accessibility Alerts: These are not errors per se, but rather suggestions to improve usability. If left unchecked, these alerts can quickly escalate into full-blown errors.
Key Accessibility Insights
Accessibility is a clear dividing line between mature and immature digital operating models. The 2026 distribution shows a fragmented landscape, with strong performers and a large group of laggards.
62.0
Avg Accessibility Score 2026
Median: 71
36.6%
Score ≥ 80
Leading performers
22.3%
Score < 40
Significant laggards
0.40
Correlation w/ R-Score
Second strongest pillar
For most users, an inaccessible website is an inconvenience. However, for roughly one in four American adults living with a disability, it is a door that does not open, with 27% having been forced to abandon an online purchase due to accessibility barriers. The 2026 WebAIM Million report shows that 95.9% of the world's top million homepages fail basic accessibility standards, and the six most common errors have not changed in seven years.
The 2026 Digital Trust Index measures this across 632 Fortune 1000 companies, and the results show a market divided sharply between organizations that have solved this problem and those that have not, with almost nothing in between.
Accessibility gaps also affect search rankings. Websites that follow WCAG guidelines naturally align with SEO best practices, improving their search rankings. Fixing accessibility is not just about inclusion; it also improves the experience for every user, including those who age into the need for larger text, higher contrast, and more navigable layouts.
The Bimodal Distribution — Confirmed Again
Accessibility scores across enterprises remain highly divided.
In the 2025 Digital Trust Index, there was no middle ground when it came to accessibility: companies were sharply divided between those meeting baseline standards and those that were not. The 2026 data shows the same structural divide — the bimodal pattern the 2025 report identified persists.
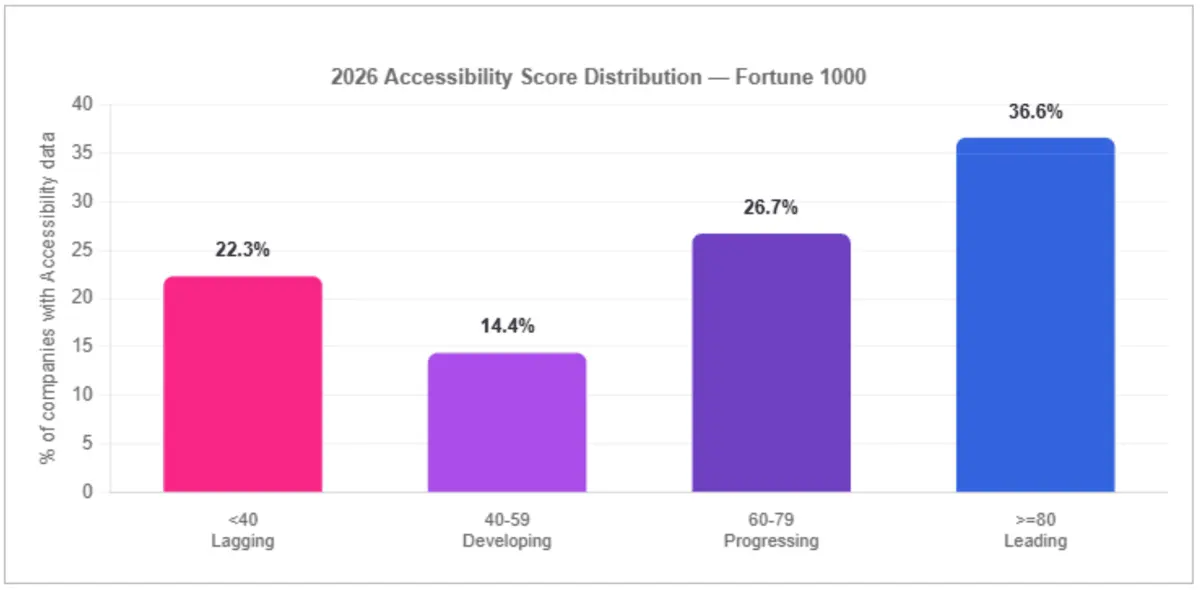
The average accessibility score is 62.0, but the median is 71, meaning more than half of Fortune 1000 companies are actually scoring above 71. The lower average is pulled down by a significant group of companies scoring below 40. That concentrated group of low scorers pulls the overall average down even though most companies are performing considerably better.
The bimodal accessibility distribution is the most structurally persistent finding in the Digital Trust Index, indicating that enterprise websites are either built with accessibility as a design constraint or not.
Accessibility by Industry
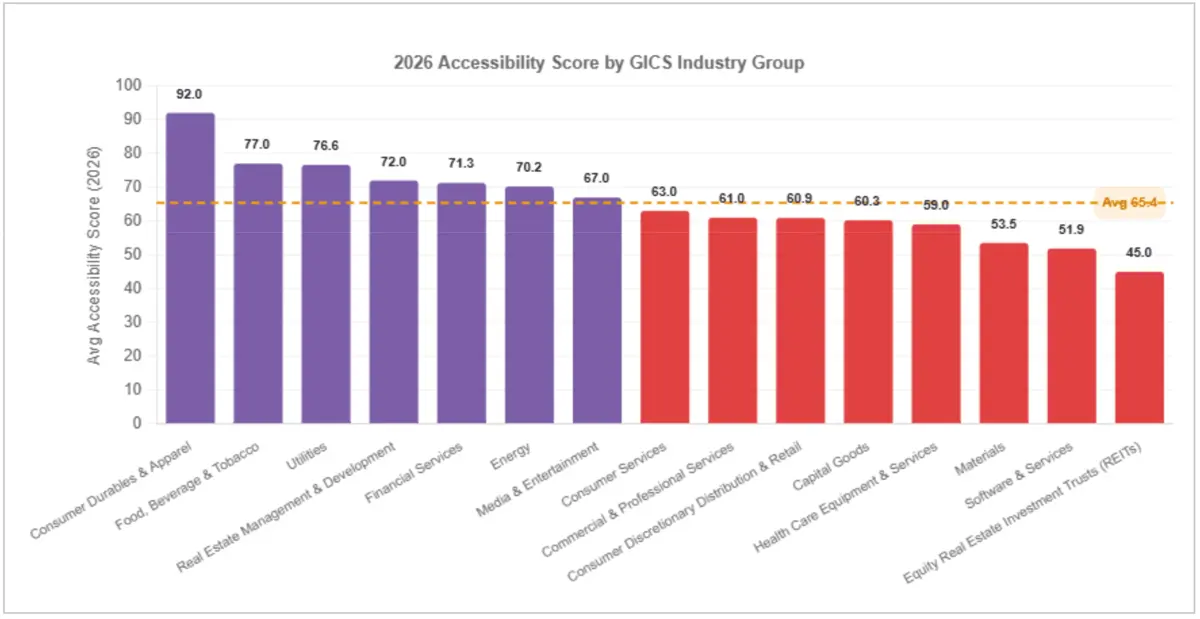
Consumer Durables & Apparel leads all measured industries at 92.0, followed by Food, Beverage & Tobacco at 77.0, Utilities at 76.6, Real Estate Management at 72.0, and Financial Services at 71.3. Consumer Durables' strong score reflects broad consumer bases where accessibility failures are visible and carry reputational cost — an incentive structure that mirrors the regulatory accountability seen in financial services.
Equity Real Estate Investment Trusts (45.0) and Software & Services (51.9) are the most significant laggards. Accessibility investment appears not to have kept pace with the digital complexity in these sectors, though the index cannot confirm what drives any individual score.
| INDUSTRY | AVG ACCESSIBILITY 2026 |
|---|---|
| Consumer Durables & Apparel | 92.0 |
| Food, Beverage & Tobacco | 77.0 |
| Utilities | 76.62 |
| Real Estate Management & Development | 72.0 |
| Financial Services | 71.28 |
| Energy | 70.24 |
| Media & Entertainment | 66.96 |
| Consumer Services | 63.0 |
| Commercial & Professional Services | 61.0 |
| Consumer Discretionary Distribution & Retail | 60.93 |
| Capital Goods | 60.26 |
| Health Care Equipment & Services | 59.05 |
| Materials | 53.54 |
| Software & Services | 51.88 |
| Equity Real Estate Investment Trusts (REITs) | 45.0 |
* Industry averages based on GICS classification. 2026 data. Industries with fewer than 3 companies excluded.
Tips and Best Practices for Improving Accessibility
Automated testing catches most contrast and labeling errors, which account for the majority of failures in the index dataset. For organizations scoring below 40, those basic fixes alone would move the needle significantly. The most common errors, including low-contrast text, missing image alt text, missing form input labels, empty links, and empty buttons, are not architectural problems but can be fixed.
- Prioritize WCAG Compliance: Aim for the highest standards, specifically striving for AAA compliance where possible. Use resources like WebAIM for practical guidance on implementing best practices to move beyond the common errors found on nearly 96% of top homepages.
- Fix Common Metadata & Visual Errors: Enterprises should ensure that images include descriptive alt text and that all form inputs have clear labels. This includes verifying that color contrast meets standard ratios to ensure legibility, as these are among the most common and fixable issues for large enterprises.
- Optimize Navigation & Forms: Address critical errors first, then proactively resolve warnings before they impact the user experience.
- Build Accessibility into the Workflow: Incorporate accessible defaults into your component library so that accessibility is automatically included when shipping new content and pages.
- Culture of Compliance: Foster a cross-functional commitment to delivering your site correctly to users of ALL abilities. Because errors occur in both code and content, editors, developers, and designers need to coordinate to achieve the best results.
- Engage with Experts and Users: Consult with accessibility experts or users who rely on assistive technology to identify subtle issues that software might overlook.
By prioritizing accessibility, enterprises can build a resilient digital platform that respects and welcomes every member of their user base. To see where your organization's accessibility score sits against Fortune 1000 benchmarks, run a free Reliability Report.
.png?width=2560&quality=75&format=pjpg&auto=webp)
.png?width=2560&quality=75&format=pjpg&auto=webp)

.png?width=2560&quality=75&format=pjpg&auto=webp)