.png?width=2560&quality=75&format=pjpg&auto=webp)
Performance: The Speed of Trust
How sub-second load times correlate with brand reliability.

How composite digital reliability improved across all 25 industries, which sectors are setting the pace, and why the strongest gains point to operational maturity rather than isolated fixes.
Avg R-Score 2026
Up from 39.24 in 2025
Average YoY Gain
Median: +8 pts
Companies Improved
Of 717 matched companies
Industries Analyzed
All groups represented
Organizations no longer just have websites. They run digital front doors, service layers, and trust engines. This is the foundation of the Digital Trust Index. The R-Score combines performance, security, and accessibility. In 2026, discoverability joins as a fourth pillar. Visibility is now part of the core experience.
The 2026 data shows clear progress. Across 717 matched companies, the average R-Score reached 49.30, up from 40.0 in 2025. The average year over year gain is +10.06 points, with a median improvement of +8 points. 71.8% of companies improved. This confirms that digital reliability is now measured and actively managed.
Digital reliability is now a managed discipline. The numbers show it. More companies improve. Scores move up. When you treat digital experience as a product, you build trust. If you do not, you fall behind.
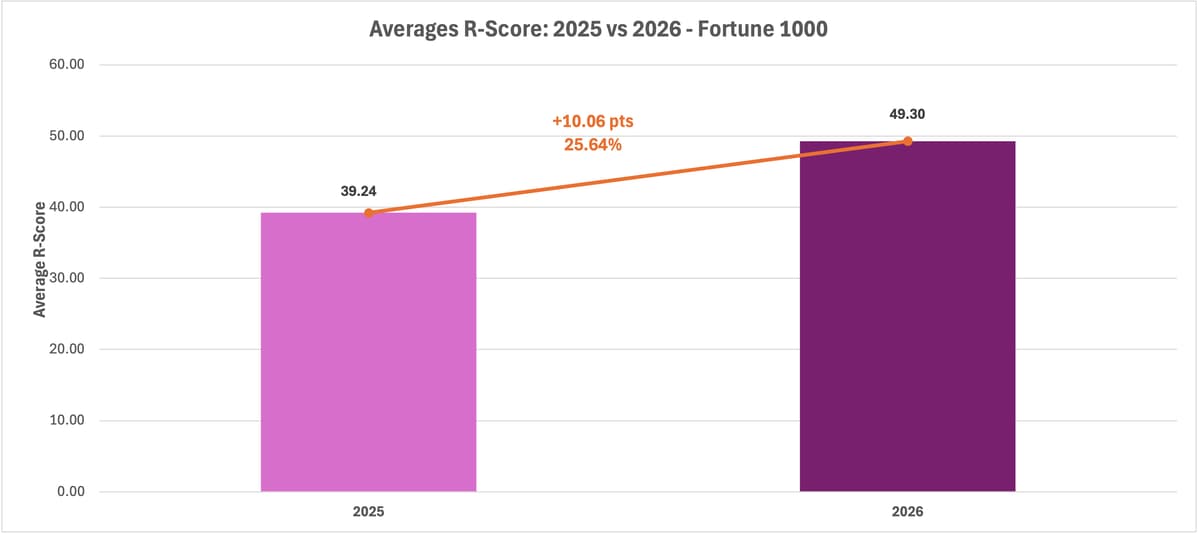
In 2025, R-Scores clustered in the high 30s. In 2026, the center moves close to 50. This is not driven by outliers. Most companies improved. The shift reflects broader investment and more consistent focus on digital reliability.
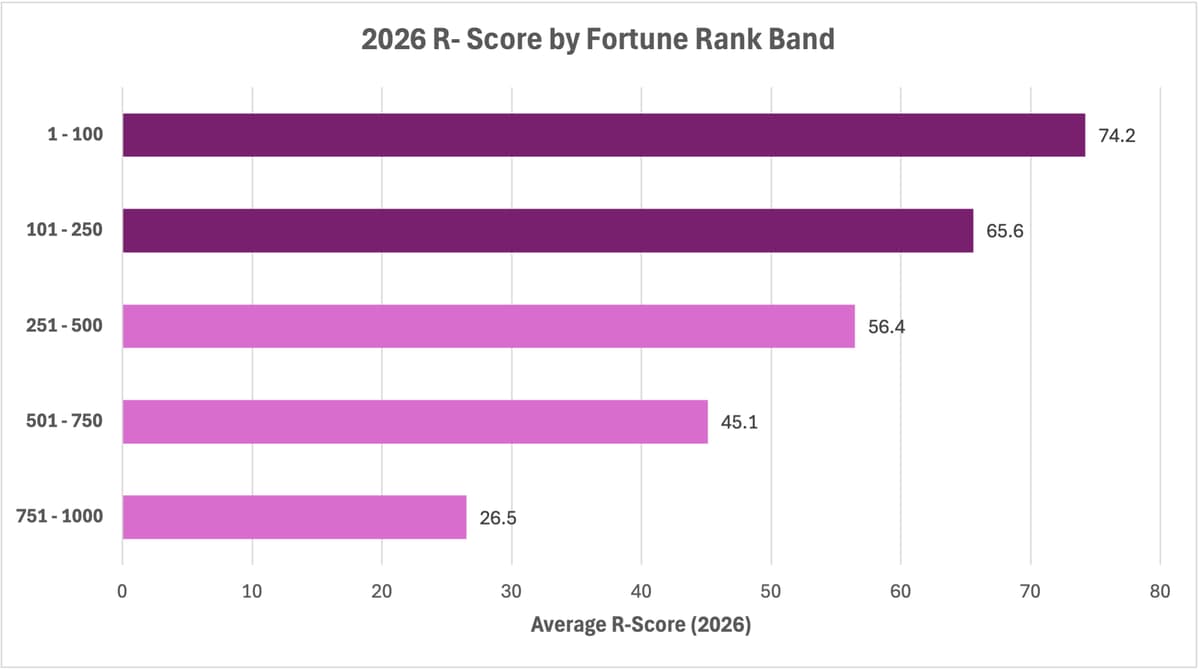
The 2025 report suggested R-Score was not strongly tied to company size. The 2026 data shows a different pattern. The Top 100 companies average 74.2, while the 751–1000 band drops to 26.5. This is a 47.7 point gap. It is structural.
R-Score declines consistently across rank bands. The 101–250 group averages 65.6, followed by 56.4 for 251–500 and 45.1 for 501–750. The drop is steady at each step.R-Score isn't positively or negatively related to employee count, annual revenue, profit, total market value, or total return to investors. Larger companies don't necessarily have better R-Scores. Your R-Score improves when you focus on website performance — regardless of revenue, employee size, or years in business.
The 2026 data shows a clear relationship between scale and digital reliability. Larger companies lead by a wide margin. This gap reflects execution, operational maturity, and sustained investment across all pillars.
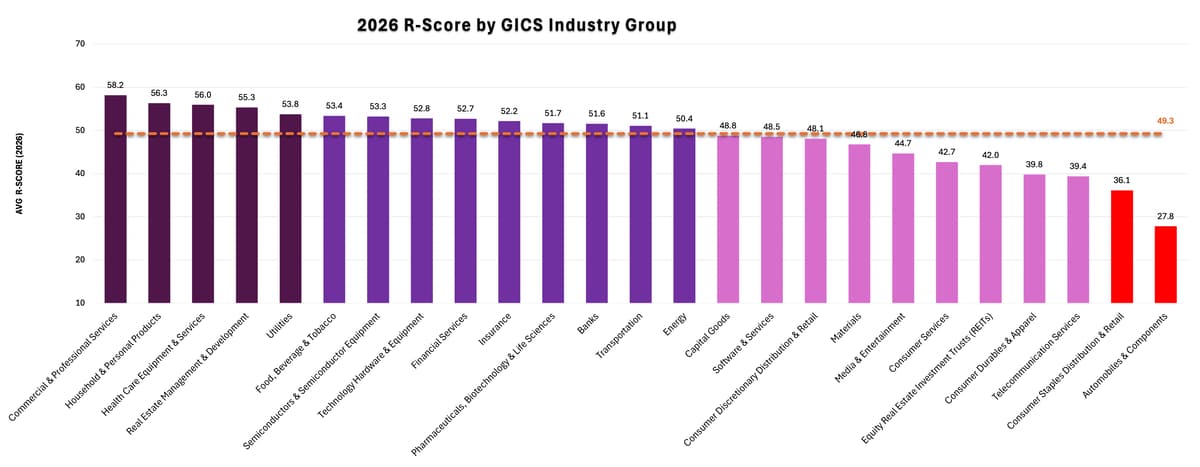
Commercial & Professional Services leads all industries at 58.2, followed by Household & Personal Products (56.3), Health Care Equipment & Services (56.0), and Real Estate Management & Development (55.3). Utilities (53.8) and Food, Beverage & Tobacco (53.4) also perform above the overall average of 49.3.
At the bottom, Automobiles & Components (27.8) and Consumer Staples Distribution & Retail (36.1) show the weakest performance. Telecommunication Services (39.4) and Consumer Durables & Apparel (39.8) also remain below average. These sectors show a clear gap between digital presence and overall reliability.
| Industry | Avg R-Score | Avg Performance | Avg Accessibility | Avg Security | Avg SEO | n |
|---|---|---|---|---|---|---|
| Commercial & Professional Services | 58.17 | 66.33 | 62.83 | 46.83 | 72.50 | 6 |
| Household & Personal Products | 56.33 | 66.33 | 43.33 | 55.00 | 61.67 | 3 |
| Health Care Equipment & Services | 55.95 | 65.45 | 60.73 | 44.68 | 67.80 | 40 |
| Real Estate Management & Development | 55.33 | 66.00 | 72.67 | 39.00 | 63.44 | 9 |
| Utilities | 53.79 | 67.21 | 59.89 | 38.16 | 65.16 | 19 |
| Food, Beverage & Tobacco | 53.42 | 59.74 | 50.16 | 48.63 | 63.74 | 19 |
| Semiconductors & Semiconductor Equipment | 53.25 | 53.75 | 55.75 | 47.50 | 72.25 | 4 |
| Technology Hardware & Equipment | 52.80 | 69.80 | 37.40 | 41.00 | 68.40 | 5 |
| Financial Services | 52.73 | 56.99 | 64.65 | 43.27 | 64.86 | 78 |
| Insurance | 52.17 | 58.33 | 76.83 | 34.17 | 67.67 | 6 |
| Pharmaceuticals, Biotechnology & Life Sciences | 51.70 | 50.70 | 66.00 | 43.00 | 72.40 | 10 |
| Banks | 51.56 | 46.44 | 77.33 | 41.78 | 72.44 | 9 |
| Transportation | 51.11 | 50.11 | 60.78 | 44.00 | 70.78 | 9 |
| Energy | 50.44 | 60.02 | 60.21 | 36.42 | 59.33 | 52 |
| Capital Goods | 48.80 | 54.98 | 54.01 | 39.51 | 61.74 | 576 |
| Software & Services | 48.52 | 50.00 | 52.84 | 43.12 | 64.28 | 25 |
| Consumer Discretionary Distribution & Retail | 48.10 | 47.17 | 63.43 | 42.17 | 61.27 | 30 |
| Materials | 46.77 | 48.23 | 51.23 | 41.69 | 61.73 | 26 |
| Media & Entertainment | 44.71 | 53.71 | 53.69 | 29.94 | 58.77 | 35 |
| Consumer Services | 42.71 | 60.14 | 55.00 | 16.43 | 63.71 | 7 |
| Equity Real Estate Investment Trusts (REITs) | 42.00 | 48.57 | 40.00 | 30.00 | 67.43 | 7 |
| Consumer Durables & Apparel | 39.83 | 31.50 | 51.00 | 36.67 | 66.83 | 6 |
| Telecommunication Services | 39.40 | 43.60 | 42.80 | 29.20 | 61.40 | 5 |
| Consumer Staples Distribution & Retail | 36.14 | 25.86 | 25.00 | 41.14 | 69.29 | 7 |
* Consumer Staples Distribution & Retail includes companies such as Walmart, Costco, Kroger, CVS, Target, and Walgreens.
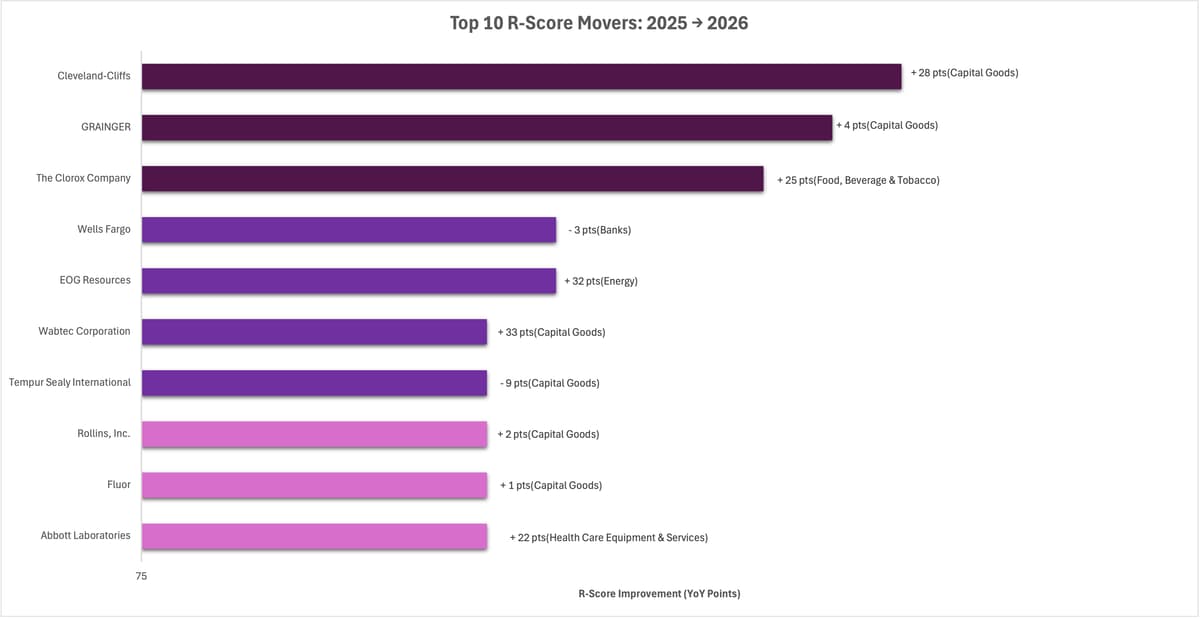
The largest year-over-year R-Score improvements show a mixed pattern across companies. Wabtec Corporation leads with +33 points, followed by EOG Resources with +32 and Cleveland-Cliffs with +28. The Clorox Company adds +25, and Abbott Laboratories gains +22.
Other movements are smaller or uneven. Grainger increases by +4, Rollins, Inc. by +2, and Fluor by +1. Wells Fargo declines by -3 and Tempur Sealy International drops by -9.
These results show that progress is not uniform. Gains concentrate in specific companies, with both strong improvements and declines within the same sectors.
| Company | Industry | 2025 | 2026 | Change |
|---|---|---|---|---|
| Cleveland-Cliffs | Capital Goods | 58 | 86 | + 28 pts |
| GRAINGER | Capital Goods | 81 | 85 | + 4 pts |
| The Clorox Company | Food, Beverage & Tobacco | 59 | 84 | + 25 pts |
| EOG Resources | Energy | 49 | 81 | + 32 pts |
| Wells Fargo | Banks | 84 | 81 | - 3 pts |
| Abbott Laboratories | Health Care Equipment & Services | 58 | 80 | + 22 pts |
| Fluor | Capital Goods | 79 | 80 | + 1 pts |
| Rollins, Inc. | Capital Goods | 78 | 80 | + 2 pts |
| Tempur Sealy International | Capital Goods | 89 | 80 | - 9 pts |
| Wabtec Corporation | Capital Goods | 47 | 80 | + 33 pts |
* Year-over-year changes based on matched company records using Industry from the 2026 dataset.
Ensure your website is high-performing and trustworthy with Oshyn’s free AI-enabled Reliability Report. This comprehensive report delivers the same deep technical insights that Oshyn used to create its prestigious Digital Trust Index.
Start Your ScanHow sub-second load times correlate with brand reliability.
A deep dive into how well a brand is found by both humans and AI agents.
An overview of why Security is the bedrock of digital trust.
This explains the transition from "checking a box" to "inclusive UX."
Whether you’re an established brand or rising through the ranks, we’ll help you identify—and fix—the specific friction points holding your digital trust back.
.png?width=2560&quality=75&format=pjpg&auto=webp)
.png?width=2560&quality=75&format=pjpg&auto=webp)
.png?width=2560&quality=75&format=pjpg&auto=webp)