
Security Insights & Best Practices from the 2026 Digital Trust Index
While performance and accessibility scores determine how users interact with your site, the security scores determine whether they should interact with it at all. At a time when consumer faith is at a historic low, your website's security is the ultimate proof of your commitment to your customers.
Although global data breach costs fell to an average of $4.44 million in 2025, U.S. organizations faced a record $10.22 million due to fines and slow detection. Yet security was the only 2026 Digital Trust Index pillar with minimal change, declining just 3.9 points; only 15.1% of matched companies improved, versus 73% for the overall R-Score.
What is the Security Pillar?
Unlike backend server security, which focuses on protecting your data "behind the door," the Security pillar in our index focuses on browser-side security. It measures how your website is built to protect users from malicious third-party attacks that occur within their own browser sessions.
Security is often a binary field in our benchmarking: organizations are either very good at it, or they aren't, with very little middle ground. Interestingly, our research shows that companies in heavily regulated industries or those that have recently suffered a data breach tend to have the highest security scores, suggesting that the impetus to improve often comes from external pressure or hard-learned lessons.
What We Measure
We analyze the protocols and permissions that your website communicates to the browser to ensure a safe session. Key areas of focus include:
- Protocol Standards: Ensuring the site exclusively uses the secure HTTPS protocol rather than the outdated and vulnerable HTTP.
- Security Policies: The presence and configuration of a Content Security Policy (CSP) and a Permissions Policy to block malicious code injection.
- Browser Permissions: Controlling what hardware and data a website can access, such as geolocation, cameras, or microphones.
- Third-Party Integrity: Monitoring for HTTP and browser security flaws that could unknowingly expose users to external actors.
Key Security Insights
Security is the pillar users assume rather than consciously evaluate — until it fails. The 2026 data reveal a market still deeply divided, with Consumer Services registering the lowest score of any industry.
41.1
Avg Security 2026
Up from 45.1 in 2025
40
Median Security Score
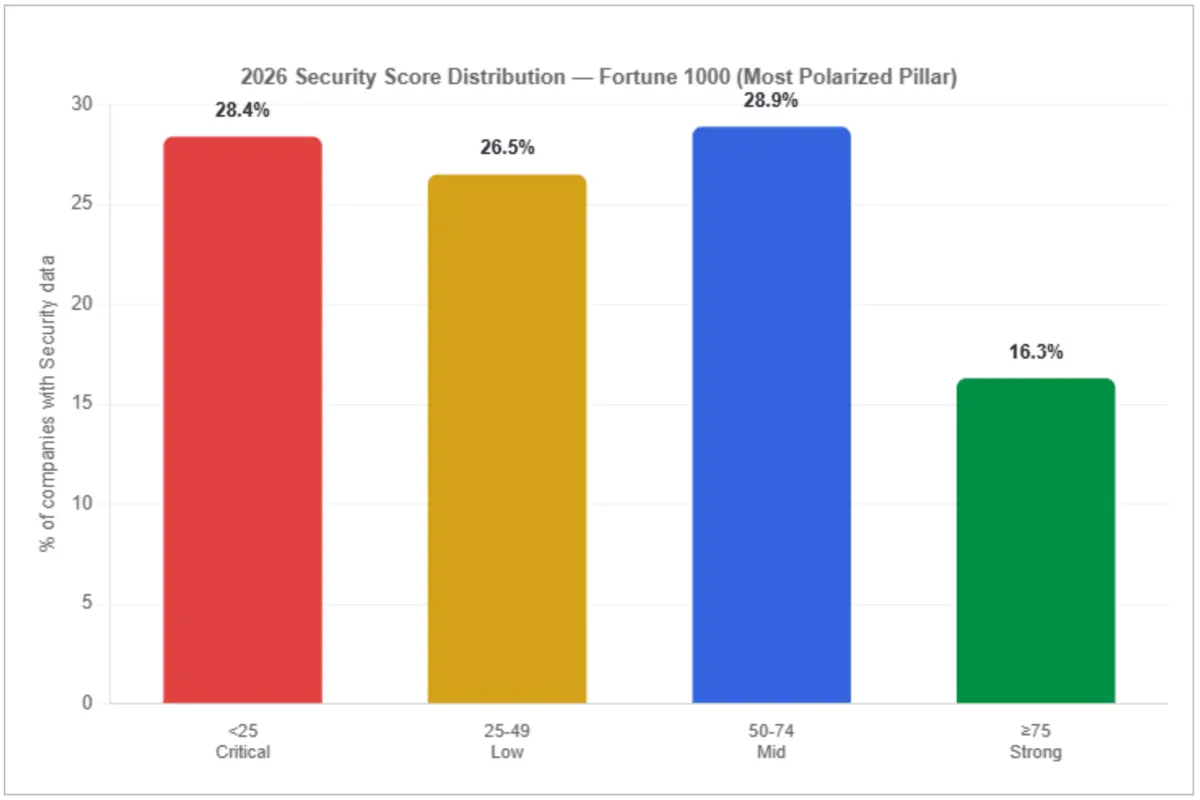
Sharply bifurcated
16.3%
Score ≥ 75
Strong performers
28.4%
Score < 25
Critical laggards
Key Takeaways
- Security was the only pillar in the 2026 Digital Trust Index that barely moved, declining just 3.9 points.
- Only 15.1% of Fortune 1000 companies improved their security score year over year, compared to 50% for the overall R-Score.
- Consumer Services, the group covering hotels, resorts, and restaurants, averages only 31.3 in security, despite scoring 33.3 in performance and 43.3 in discoverability.
- Given that U.S. organizations are facing record-average data breach costs of $10.22 million, these figures emphasize why security should be a primary focus for those seeking to improve Digital Trust.
Only 15% of Fortune 1000 Companies Improved Their Security Score
Security is assumed until it fails. In 2026, the market remained divided, with Consumer Services earning the lowest industry score.
Security most directly shapes user confidence. However, only 15.1% of matched companies improved, while 58% improved performance and 50% raised overall R-Scores. The 2026 Index showed organizations excel at or struggle with security, with little middle ground. The median score was 40; around 16.3% scored 75+, and 28.4% scored below 25.
Notably, companies in heavily regulated industries or those that have recently suffered a data breach tend to have the highest security scores, suggesting that the impetus to improve often comes from external pressure or hard-learned lessons.
Security by Industry
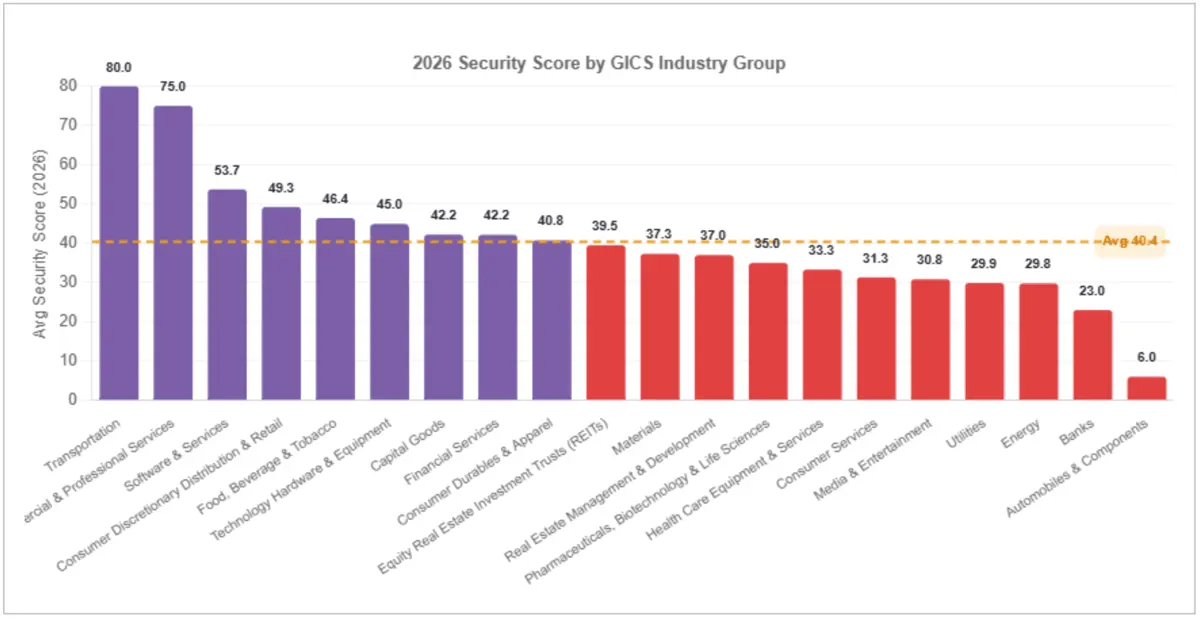
Commercial & Professional Services leads security at 75.0, followed by Software & Services at 57.57 and Food, Beverage & Tobacco at 54.17. At the bottom: Consumer Services at 31.33 and Media & Entertainment at 39.39.
Business services and software companies lead because their clients demand security attestation — B2B relationships carry explicit security requirements through vendor assessments, SOC 2 audits, and contractual obligations. Consumer services and media companies face a different forcing function: security failures manifest as public incidents, not contract violations. Without a direct commercial trigger, security investment remains reactive.
| Industry | 2026 Avg Security | 2026 Avg R-Score | n |
|---|---|---|---|
| Transportation | 80.0 | 68.0 | 1 |
| Commercial & Professional Services | 75.0 | 67.0 | 3 |
| Software & Services | 53.73 | 51.9 | 15 |
| Consumer Discretionary Distribution & Retail | 49.25 | 51.3 | 16 |
| Food, Beverage & Tobacco | 46.43 | 60.1 | 7 |
| Technology Hardware & Equipment | 45.0 | 55.0 | 1 |
| Capital Goods | 42.22 | 50.6 | 421 |
| Financial Services | 42.16 | 53.7 | 50 |
| Consumer Durables & Apparel | 40.75 | 41.0 | 4 |
| Equity Real Estate Investment Trusts (REITs) | 39.5 | 43.6 | 6 |
| Materials | 37.31 | 48.2 | 13 |
| Real Estate Management & Development | 37.0 | 51.8 | 8 |
| Pharmaceuticals, Biotechnology & Life Sciences | 35.0 | 45.5 | 2 |
| Health Care Equipment & Services | 33.3 | 51.8 | 20 |
| Consumer Services | 31.33 | 36.7 | 3 |
| Media & Entertainment | 30.83 | 49.6 | 23 |
| Utilities | 29.88 | 45.8 | 8 |
| Energy | 29.77 | 48.6 | 22 |
| Banks | 23.0 | 32.0 | 1 |
| Automobiles & Components | 6.0 | 35.0 | 2 |
| Consumer Staples Distribution & Retail | — | 0 | |
| Household & Personal Products | — | 0 | |
| Insurance | — | 0 | |
| Semiconductors & Semiconductor Equipment | — | 0 | |
| Telecommunication Services | — | 0 |
* All 25 GICS Industry Groups. Sorted by security score. — = no 2026 data available. n = companies with Security data.
When Security Improves, It Improves Decisively
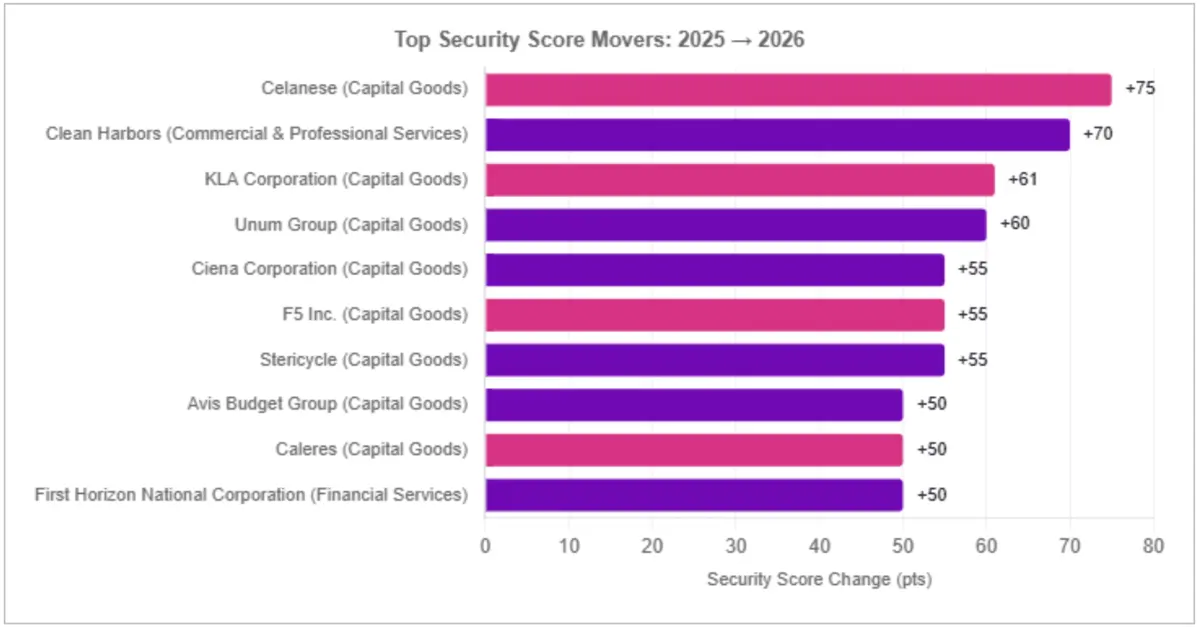
When security improves, it improves decisively. The top 10 movers averaged +60 points in a single year. This is not the story of gradual hardening — it is the story of organizations that crossed a threshold and invested comprehensively. The window for proactive action is open. Waiting for a breach to be the trigger is the most expensive way to close it.
Tips and Best Practices for Improving Security
Building a secure digital experience means anticipating threats before breaches. Consumer Services’ low 20.7 score suggests CSP and browser permissions are missing at many hotels, restaurants, and resorts. For those organizations, implementing HTTPS and a basic Content Security Policy gives the fastest improvement. Other security tips include:
- Enforce Site-Wide HTTPS: Use the HTTPS protocol across your entire website, not just on login or checkout pages, to ensure all data flowing between the server and the browser is encrypted.
- Enforce a Robust CSP and Permissions Policy: Deploying a Content Security Policy (CSP) and a Permissions Policy are the highest-leverage steps for browser-side security. These tell the browser exactly which scripts and plugins are trusted, and help to prevent malicious code injection.
- Apply the Principle of Least Privilege: Frequently review website permissions and disable access to hardware such as microphones, cameras, and geolocation when not strictly required.
- Vet Third-Party Providers: Only reliable third-party providers for video players, analytics tools, and embeds, as these are common vectors for browser-side security exposure.
- Maintain Proactive Compliance: Stay current with data security laws (e.g., GDPR and CCPA) and routinely update cookie security and privacy policies.
- Prioritize Prevention Over Recovery: Don't wait until a breach happens to improve your security posture. While companies often improve rapidly after an incident, it comes at a high cost of damage to reputation and the difficult task of rebuilding fractured trust.
By prioritizing these browser-level safeguards, brands can create a secure space where users can engage with confidence, knowing their digital safety is a top priority. To see where your organization's security score sits against Fortune 1000 benchmarks, run a free Reliability Report scan.
.png?width=2560&quality=75&format=pjpg&auto=webp)
.png?width=2560&quality=75&format=pjpg&auto=webp)

.png?width=2560&quality=75&format=pjpg&auto=webp)