
.png?width=2560&quality=75&format=pjpg&auto=webp)
Performance: The Speed of Trust
How sub-second load times correlate with brand reliability.

Even the fastest, most secure, and most accessible site in the world cannot build trust if your audience can’t find it. In a landscape increasingly dominated by AI-driven search and sophisticated algorithms, being "findable" is a core component of digital reliability.
The Oshyn Digital Trust Index evaluates this through the Discoverability pillar, which measures how effectively your website communicates its value and content to both human users and automated systems.
Discoverability is the bridge between your brand’s expertise and the user’s intent. It measures how well your site is optimized for search engines and, increasingly, for generative AI engines. When a website is highly discoverable, it provides clear signals about its authority, structure, and the relevance of its information.
In the 2026 Index, discoverability has evolved beyond traditional SEO. It now encompasses how easily information can be parsed by "answer engines"—the AI tools that users now use to summarize information without ever clicking a link. If your site is invisible to these tools, you lose the opportunity to be the source of truth for your customers.
To assess discoverability, we look at the technical markers that help search engines index and rank your content. Key metrics include:
In 2025, Discoverability sat outside the Digital Trust Index. In 2026, it earns a seat at the table — and the industry data shows why reach and reliability must be managed together.
Avg Discoverability Score 2026
New pillar — highest avg of any
Score ≥ 70
Strong performers
Score < 50
Low discoverability
Correlation w/ R-Score
Independent of reliability
The 2025 Digital Trust Index was explicit. SEO, or discoverability, was evaluated but not included in the benchmark. In 2026, that changes. Discoverability becomes a core pillar and is now integrated directly into the R-Score.
The 2026 data shows a strong baseline. The average discoverability score reaches 62.77, the highest across all pillars. At the same time, its correlation with R-Score is 0.52. This is a critical signal. Discoverability operates as a largely independent dimension. Being easy to find does not mean being reliable or secure. You must manage both separately.
The distribution reinforces this. 29.3% of companies score 70 or higher, showing strong visibility performance. Only 6.7% fall below 50. Most companies sit in the middle, with moderate discoverability but no clear dominance. This is not a polarized market. It is a competitive one, where many companies are visible but not differentiated.
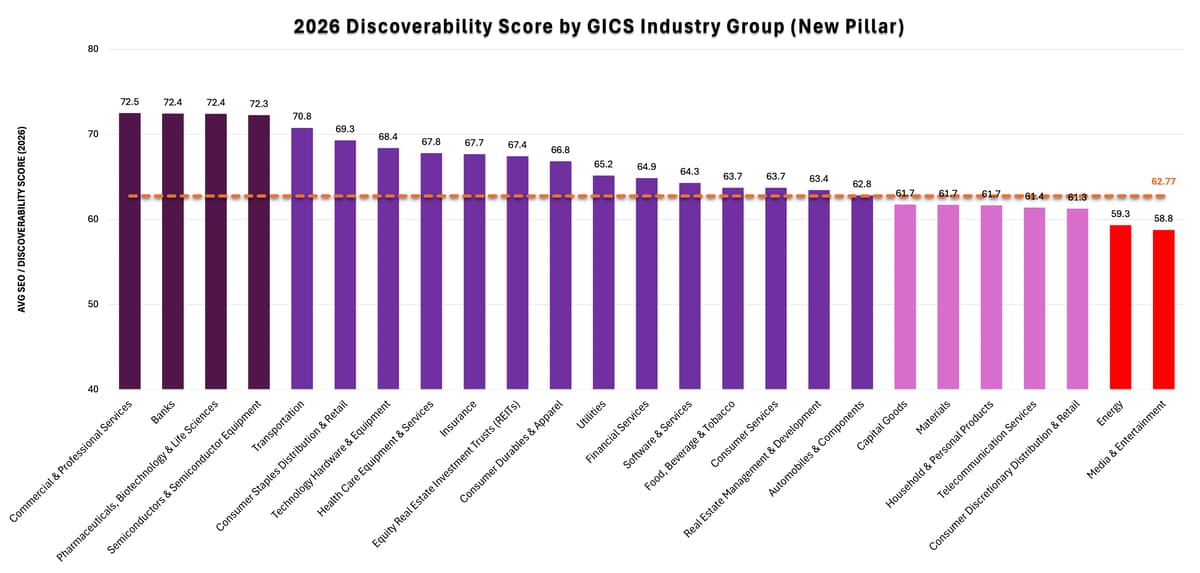
Commercial & Professional Services (72.5), Banks (72.4), and Pharmaceuticals, Biotechnology & Life Sciences (72.4) lead on discoverability, followed closely by Semiconductors & Semiconductor Equipment (72.3). Transportation (70.8) and Consumer Staples Distribution & Retail (69.3) also perform strongly. These industries show consistent execution in SEO, content structure, and demand capture.
Technology Hardware & Equipment (68.4), Health Care Equipment & Services (67.8), Insurance (67.7), and Equity Real Estate Investment Trusts (67.4) maintain solid performance above the average. They demonstrate good alignment with search behavior, but with less dominance than the top group.
Utilities (65.2), Financial Services (64.9), Software & Services (64.3), and Food, Beverage & Tobacco (63.7) cluster near the average of 62.77. These industries have stable visibility but limited differentiation in search performance.
At the lower end, Capital Goods (61.7), Materials (61.7), Household & Personal Products (61.7), and Telecommunication Services (61.4) fall slightly below the average. Consumer Discretionary Distribution & Retail (61.3) follows a similar pattern.
Energy (59.3) and Media & Entertainment (58.8) rank at the bottom. These industries show weaker visibility, with gaps in content coverage and SEO execution that limit their ability to capture organic demand.
| Industry | Avg Discoverability Score | Avg R-Score | Avg Security | Discoverability vs R Gap | n |
|---|---|---|---|---|---|
| Commercial & Professional Services | 72.50 | 58.17 | 46.83 | 14.33 | 6 |
| Banks | 72.44 | 51.56 | 41.78 | 20.88 | 9 |
| Pharmaceuticals, Biotechnology & Life Sciences | 72.40 | 51.70 | 43.00 | 20.70 | 10 |
| Semiconductors & Semiconductor Equipment | 72.25 | 53.25 | 47.50 | 19.00 | 4 |
| Transportation | 70.78 | 51.11 | 44.00 | 19.67 | 9 |
| Consumer Staples Distribution & Retail | 69.29 | 36.14 | 41.14 | 33.15 | 7 |
| Technology Hardware & Equipment | 68.40 | 52.80 | 41.00 | 15.60 | 5 |
| Health Care Equipment & Services | 67.80 | 55.95 | 44.68 | 11.85 | 40 |
| Insurance | 67.67 | 52.17 | 34.17 | 15.50 | 6 |
| Equity Real Estate Investment Trusts (REITs) | 67.43 | 42.00 | 30.00 | 25.43 | 7 |
| Consumer Durables & Apparel | 66.83 | 39.83 | 36.67 | 27.00 | 6 |
| Utilities | 65.16 | 53.79 | 38.16 | 11.37 | 19 |
| Financial Services | 64.86 | 52.73 | 43.27 | 12.13 | 78 |
| Software & Services | 64.28 | 48.52 | 43.12 | 15.76 | 25 |
| Food, Beverage & Tobacco | 63.74 | 53.42 | 48.63 | 10.32 | 19 |
| Consumer Services | 63.71 | 42.71 | 16.43 | 21.00 | 7 |
| Real Estate Management & Development | 63.44 | 55.33 | 39.00 | 8.11 | 9 |
| Automobiles & Components | 62.83 | 27.83 | 20.50 | 35.00 | 6 |
| Capital Goods | 61.74 | 48.80 | 39.51 | 12.94 | 576 |
| Materials | 61.73 | 46.77 | 41.69 | 14.96 | 26 |
| Household & Personal Products | 61.67 | 56.33 | 55.00 | 5.34 | 3 |
| Telecommunication Services | 61.40 | 39.40 | 29.20 | 22.00 | 5 |
| Consumer Discretionary Distribution & Retail | 61.27 | 48.10 | 42.17 | 13.17 | 30 |
| Energy | 59.33 | 50.44 | 36.42 | 8.89 | 52 |
| Media & Entertainment | 58.77 | 44.71 | 29.94 | 14.06 | 35 |
* Discoverability vs R Gap shows the difference between discoverability and the composite R-Score. Positive gaps indicate industries with strong visibility but weaker overall trust performance, often driven by lower security, performance, or accessibility scores. Negative gaps indicate the opposite, where technical strength exists but visibility remains limited. The size of the gap reflects how unbalanced these two dimensions are.
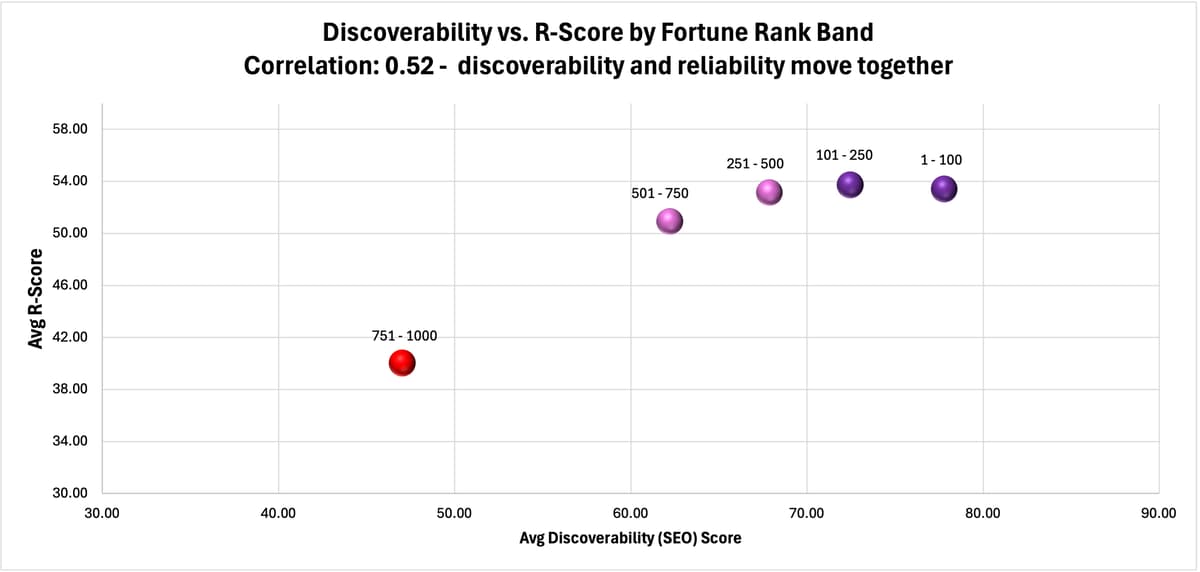
The scatter shows a moderate relationship at the rank band level. Correlation is 0.52. Higher-ranked companies combine stronger visibility and higher R-Score. The 1–100 group reaches 77.79 in discoverability and 53.41 in R-Score. The 751–1000 group drops to 47.02 and 40.03.
The gap is clear. Discoverability declines sharply across bands, while R-Score decreases at a slower pace. This shows visibility is not enough. Security, performance, and accessibility still define overall trust.
Leaders manage both dimensions. They optimize for discoverability and build strong technical foundations at the same time.
| Quadrant | Discoverability | R-Score | Risk | Strategic Priority |
|---|---|---|---|---|
| Trusted & Found | High | High | Low | Sustain and defend both dimensions |
| Found But Frustrating | High | Low | High | Fix reliability — High visibility with poor experience |
| Reliable But Hidden | Low | High | Medium | Invest in discoverability and content strategy |
| Struggling | Low | Low | Critical | Full digital reset required |
* Consumer Staples Distribution & Retail exemplifies “Found But Frustrating”— high Discoverability (69.3), low R-Score (36.1), security (41.11).
Improving discoverability requires a shift from "keyword stuffing" to high-quality, structured communication that satisfies both humans and machines.
By mastering discoverability, you ensure that your investment in performance, security, and accessibility is seen by the people who need it most.
Ensure your website is high-performing and trustworthy with Oshyn’s free AI-enabled Reliability Report. This comprehensive report delivers the same deep technical insights that Oshyn used to create its prestigious Digital Trust Index.
Start Your ScanHow sub-second load times correlate with brand reliability.
What trends and observations were uncovered in this year’s edition of the Digital Trust Index? Read on to find out.
An overview of why Security is the bedrock of digital trust.
This explains the transition from "checking a box" to "inclusive UX."
Whether you’re an established brand or rising through the ranks, we’ll help you identify—and fix—the specific friction points holding your digital trust back.

.png?width=2560&quality=75&format=pjpg&auto=webp)
.png?width=2560&quality=75&format=pjpg&auto=webp)