
.png?width=2560&quality=75&format=pjpg&auto=webp)
Security: Fortify Your Presence
An overview of why Security is the bedrock of digital trust.

TABLE OF CONTENTS
In the digital-first economy, your website is no longer just a marketing asset — it is the primary interface for your brand's relationship with the world. However, that relationship is increasingly fragile. As consumer expectations for instantaneous experiences reach an all-time high, even a few seconds of delay can erode years of brand equity.
The Oshyn Digital Trust Index was established to quantify the "R-Score" — a measure of digital reliability across the three pillars of Performance, Security, and Accessibility. Of these, Performance is the most immediate; it is the physical sensation of your brand's digital presence. When a site is fast and responsive, it signals competence and respect for the user's time. When it lags, that trust begins to fracture before a single word of content is even read.
In this 2026 edition, we break down the Performance pillar: how we measure the technical heartbeat of the world's leading websites, the specific metrics that dictate success in modern search engines, and the actionable strategies your team can implement to ensure your digital front door swings open instantly for every visitor.
The Performance pillar measures how effectively your website allows users to accomplish their tasks. At its core, it evaluates website speed and general responsiveness.
A high-performing website must load quickly and remain easy to navigate, even when a user's network is not performing optimally. This is not just about user experience; Google explicitly uses page performance as a key factor in its search rankings, meaning your performance score directly impacts your SEO visibility.
To evaluate performance, the Digital Trust Index analyzes "lab data"—controlled results that provide a snapshot of technical health. Key metrics include:
Speed remains the most immediately felt layer of trust — and the 2026 data shows a market that is getting materially better at delivering it.
Avg Performance 2026
Up from 40.1 in 2025
Average YoY Gain
Median: +21.0 pts
Companies Improved
Of matched companies
Correlation w/ R-Score
Strongest of all pillars
Performance is the most visible part of digital reliability. Users do not measure Core Web Vitals, but they feel delays, layout shifts, and slow interactions immediately. Speed directly impacts engagement, conversion, and perceived trust.
The 2026 data shows strong progress. Average performance reached 61.1, up from 40.1 in 2025. A majority of companies, 57.6%, improved year over year. The average gain of +21.0 points shows meaningful optimization across the market, while the median gain of +21.0 points reveals uneven progress. A smaller group is driving most of the improvement, while many companies are advancing more slowly.
Performance continues to show the strongest relationship with overall reliability. The correlation with R-Score is 0.60, higher than other pillars. This indicates that improvements in performance translate directly into a better overall digital experience.
Performance is the clearest signal of digital trust. Every user feels it instantly. In 2026, performance reached 61.1, with 57.6% of companies improving year over year. Gains are meaningful, but not evenly distributed, as reflected in a median increase of +21.0 points. Performance also shows the strongest alignment with overall reliability, with a correlation of 0.60. Improve performance, and you improve trust.
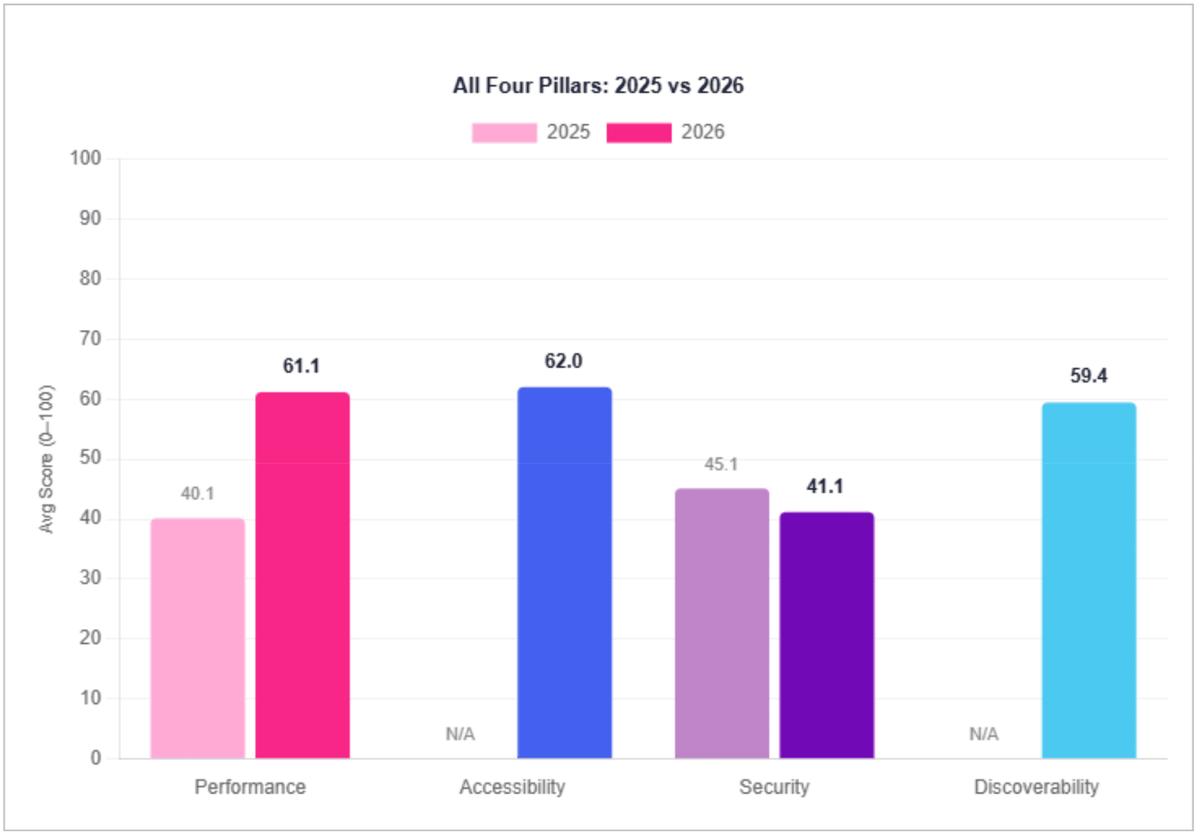
Performance shows the strongest year over year improvement. It increases from 40.1 in 2025 to 61.1 in 2026, a gain of +21.0 points. Accessibility debuts at 62.0. Security shows limited improvement. Discoverability enters the index as the highest-scoring new pillar.
Performance and security were not strongly correlated. Different teams owned them. Many organizations faced siloed systems and integration gaps, which limited consistent digital experience delivery.
The 2026 data shows clear progress, led by performance. Gains at this level point to better alignment across teams. This is not just isolated optimization.
All pillars move up, but at different speeds. Performance leads. Discoverability starts strong. Security improves slowly. Accessibility shows solid positioning but still needs consistency.
Progress is real. Full cross functional maturity is still evolving.
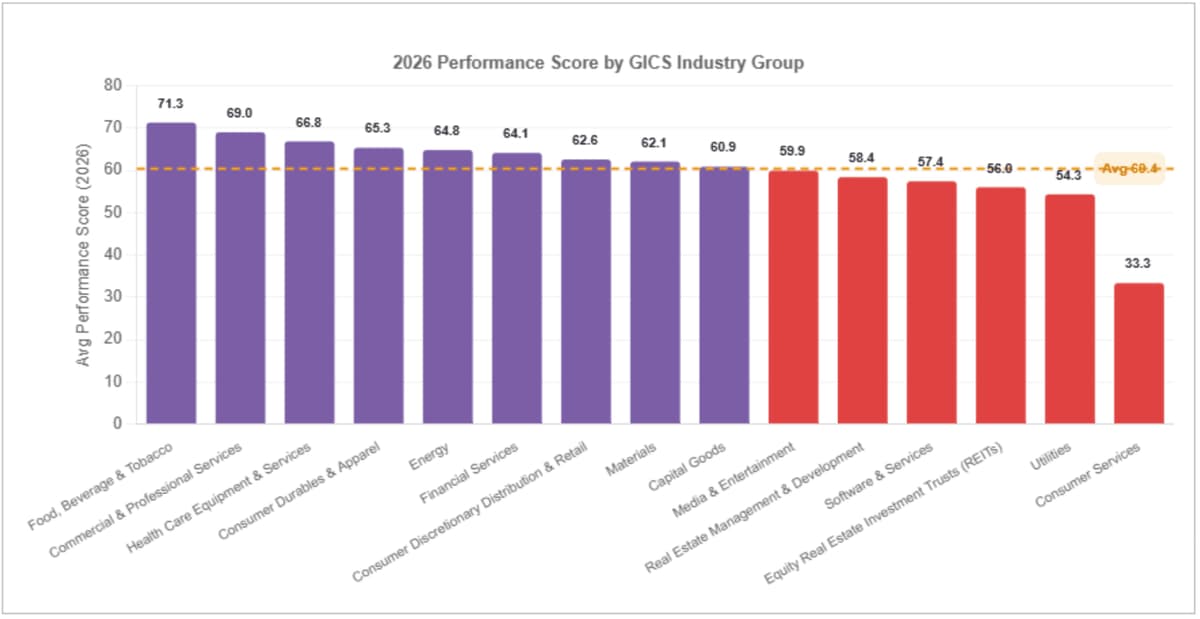
Food, Beverage & Tobacco leads all industries on performance at 71.29, followed by Commercial & Professional Services at 69.0, Health Care Equipment & Services at 66.85, and Utilities at 64.0. These sectors show strong operational discipline, where user-facing services demand faster and more reliable experiences.
At the lower end, Consumer Services (33.33) and Automobiles & Components fall furthest below the average. These sectors lag in delivering consistent frontend performance relative to user expectations. Accessibility investment appears not to have kept pace with the complexity of the digital estate in these sectors.
| GICS Industry Group | 2026 Avg Performance | 2026 Avg R-Score | n |
|---|---|---|---|
| Transportation | 77.0 | 68.0 | 1 |
| Food, Beverage & Tobacco | 71.29 | 60.1 | 7 |
| Commercial & Professional Services | 69.0 | 67.0 | 3 |
| Health Care Equipment & Services | 66.85 | 51.8 | 20 |
| Consumer Durables & Apparel | 65.33 | 41.0 | 3 |
| Energy | 64.8 | 48.6 | 25 |
| Financial Services | 64.12 | 53.7 | 48 |
| Consumer Discretionary Distribution & Retail | 62.57 | 51.3 | 14 |
| Materials | 62.08 | 48.2 | 12 |
| Capital Goods | 60.85 | 50.6 | 422 |
| Media & Entertainment | 59.91 | 49.6 | 23 |
| Automobiles & Components | 59.0 | 35.0 | 2 |
| Real Estate Management & Development | 58.38 | 51.8 | 8 |
| Software & Services | 57.4 | 51.9 | 15 |
| Equity Real Estate Investment Trusts (REITs) | 56.0 | 43.6 | 6 |
| Utilities | 54.33 | 45.8 | 9 |
| Technology Hardware & Equipment | 50.0 | 55.0 | 1 |
| Pharmaceuticals, Biotechnology & Life Sciences | 39.0 | 45.5 | 2 |
| Consumer Services | 33.33 | 36.7 | 3 |
| Banks | — | 32.0 | 0 |
| Consumer Staples Distribution & Retail | — | 0 | |
| Household & Personal Products | — | 0 | |
| Insurance | — | 0 | |
| Semiconductors & Semiconductor Equipment | — | 0 | |
| Telecommunication Services | — | 0 |
* All 25 GICS Industry Groups. Sorted by performance score. — = no 2026 data available. n = companies with Performance data.
Improving your performance score requires a holistic approach, from backend infrastructure to frontend code. Here are several best practices to boost your site’s speed:
By focusing on these technical foundations, brands can move beyond simple compliance and build a faster, more reliable digital experience that honors their users' time and trust.
Ensure your website is high-performing and trustworthy with Oshyn’s free AI-enabled Reliability Report. This comprehensive report delivers the same deep technical insights that Oshyn used to create its prestigious Digital Trust Index.
Start Your ScanAn overview of why Security is the bedrock of digital trust.
This explains the transition from "checking a box" to "inclusive UX."
What trends and observations were uncovered in this year’s edition of the Digital Trust Index? Read on to find out.
A deep dive into how well a brand is found by both humans and AI agents.
Whether you’re an established brand or rising through the ranks, we’ll help you identify—and fix—the specific friction points holding your digital trust back.
.png?width=2560&quality=75&format=pjpg&auto=webp)

.png?width=2560&quality=75&format=pjpg&auto=webp)